Let's Learn Dash - A Data Visualization Framework based on Python: Part 1
Python Web Framework


You have seen websites that beautify data visualization, and graph visualization but often get intimated upon how complex the development of such websites can be. So there are many frameworks. One such framework is Dash
What is Dash?
Dash is an open-source framework for building data visualization interfaces. Dash helps data scientists build analytical web applications without requiring advanced web development knowledge.
The constituents of Dash
Three technologies constitute the core of Dash:
Flask supplies the web server functionality.
React.js renders the user interface of the web page.
Plotly.js generates the charts used in your application.
Vision of Dash
To build visually appealing dashboards for graph and data visualization
How to build a Dash Application
For development purposes, it’s useful to think of the process of building a Dash application in three steps:
Define the content of your application using the app’s layout.
Style the looks of your app with CSS or styled components.
Use callbacks to determine which parts of your app are interactive and what they react to.
To follow along you can do the following steps:
To create a folder.
mkdir avocado_analytics
To change directory to the newly created folder.
cd avocado_analytics
Install virtualenv
python -m pip install --user virtualenv
To set up virtual environment so that designated versions of required modules can be installed
python -m venv venv
To activate virtual environment venv
venv\Scripts\activate
It should look like this (for me the folder structure is little, not to be confused with)

Then we have to install the necessary python modules
(venv) $ python -m pip install dash==2.8.1 pandas==1.5.3
Here we are using Dash v2.8.1 and Pandas v1.5.3
You’ll use specific versions of these packages to make sure that you have the same environment as the one used throughout this blog. Alongside Dash, pandas will help you handle reading and wrangling the data that you’ll use in your app.
Link to download the CSV file
Avocado-Analysis/avocado.csv at main · srummanf/Avocado-Analysis (github.com)
Initialize your first Dash Application
import pandas as pd
from dash import Dash, dcc, html

data = (
    pd.read_csv("avocado.csv")
    .query("type == 'conventional' and region == 'Albany'")
    .assign(Date=lambda data: pd.to_datetime(data["Date"], format="%Y-%m-%d"))
    .sort_values(by="Date")
)

app = Dash(__name__)
We use pandas to read and organize the data. Dash is used to set up the application with data visualization functions. dcc and html allows you to create html tag and core components which are rendered in React.
In these lines of code we filter few datas based on the programmer's choice (hard-coded) later we will be making it interactive. At the last line we create an instance of the Dash class and set the Flask application which is an WSGI Application
Treat: What is WSGI application
Accordinng to WSGI.org
WSGI is the Web Server Gateway Interface. It is a specification that describes how a web server communicates with web applications, and how web applications can be chained together to process one request.
Now we will start defining the layout of the web application. In app.py add the following code snippet
app.layout = html.Div(
    children=[
        html.H1(children="Avocado Analytics"),
        html.P(
            children=(
                "Analyze the behavior of avocado prices and the number"
                " of avocados sold in the US between 2015 and 2018"
            ),
        ),
        dcc.Graph(
            figure={
                "data": [
                    {
                        "x": data["Date"],
                        "y": data["AveragePrice"],
                        "type": "lines",
                    },
                ],
                "layout": {"title": "Average Price of Avocados"},
            },
        ),
        dcc.Graph(
            figure={
                "data": [
                    {
                        "x": data["Date"],
                        "y": data["Total Volume"],
                        "type": "lines",
                    },
                ],
                "layout": {"title": "Avocados Sold"},
            },
        ),
    ]
)
Let's breakdown the above code snippet.
app.layout is used to define the layout of the application. If you compare with Web Development you can compare it with <body></body> tag. We will be now making div inside the application using html.Div component. children refers to the content inside the div which can either be a text or a next div element. dcc.Graph is used to make the interactive graph. We will be passing params inside this component. figure is a dictionary which takes the data as list dictionary in which we define the values of x axis, y axis and type of graph. layout key takes the value of title of the graph.
Note:
html.Div(
    children="Avocado Analytics",
    className="Header",
    style={"fontSize": "48px", "color": "red"},
)
is equivalent to
<div class="Header" style={"font-size": "48px", "color": "red"}>Avocado Analytics</div>
and
html.Div(
    children=[
        html.H1(children="Avocado Analytics", className="H1-class"),
        html.P(
            children=(
                "Analyze the behavior of avocado prices and the number"
                " of avocados sold in the US between 2015 and 2018"
            ),
            className="P-class",
        ),
    ],
    className="Div-class",
)
is equivalent to
<div class="Div-class">
  <h1 class="H1-class">Avocado Analytics
  </h1>
  <p class="P-class">Analyze the behavior of avocado prices and the number
    of avocados sold in the US between 2015 and 2018
  </p>
</div>
you can notice how we used children="" for text and children=[] for nesting other components/tags.
So you’ll see two sets of components in almost every app:
The Dash HTML Components or
htmlmodule provides you with Python wrappers for HTML elements.The Dash Core Components or
dccmodule provides you with Python abstractions for creating interactive user interfaces. You can use these components to create interactive elements such as graphs, sliders, or dropdowns.
Under the hood, Dash uses Plotly.js to generate graphs.
Now to launch the application we have to add 2 lines of code in our app.py and command terminal
if __name__ == "__main__":
    app.run_server(debug=True)
We are using Flask in-built server to run our application
Your complete code : app.py
# app.py

import pandas as pd
from dash import Dash, dcc, html

data = (
    pd.read_csv("avocado.csv")
    .query("type == 'conventional' and region == 'Albany'")
    .assign(Date=lambda data: pd.to_datetime(data["Date"], format="%Y-%m-%d"))
    .sort_values(by="Date")
)

app = Dash(__name__)

app.layout = html.Div(
    children=[
        html.H1(children="Avocado Analytics"),
        html.P(
            children=(
                "Analyze the behavior of avocado prices and the number"
                " of avocados sold in the US between 2015 and 2018"
            ),
        ),
        dcc.Graph(
            figure={
                "data": [
                    {
                        "x": data["Date"],
                        "y": data["AveragePrice"],
                        "type": "lines",
                    },
                ],
                "layout": {"title": "Average Price of Avocados"},
            },
        ),
        dcc.Graph(
            figure={
                "data": [
                    {
                        "x": data["Date"],
                        "y": data["Total Volume"],
                        "type": "lines",
                    },
                ],
                "layout": {"title": "Avocados Sold"},
            },
        ),
    ]
)

if __name__ == "__main__":
    app.run_server(debug=True)
Inorder to execute, go to terminal (make sure you are in your venv)
python app.py
Voila!!
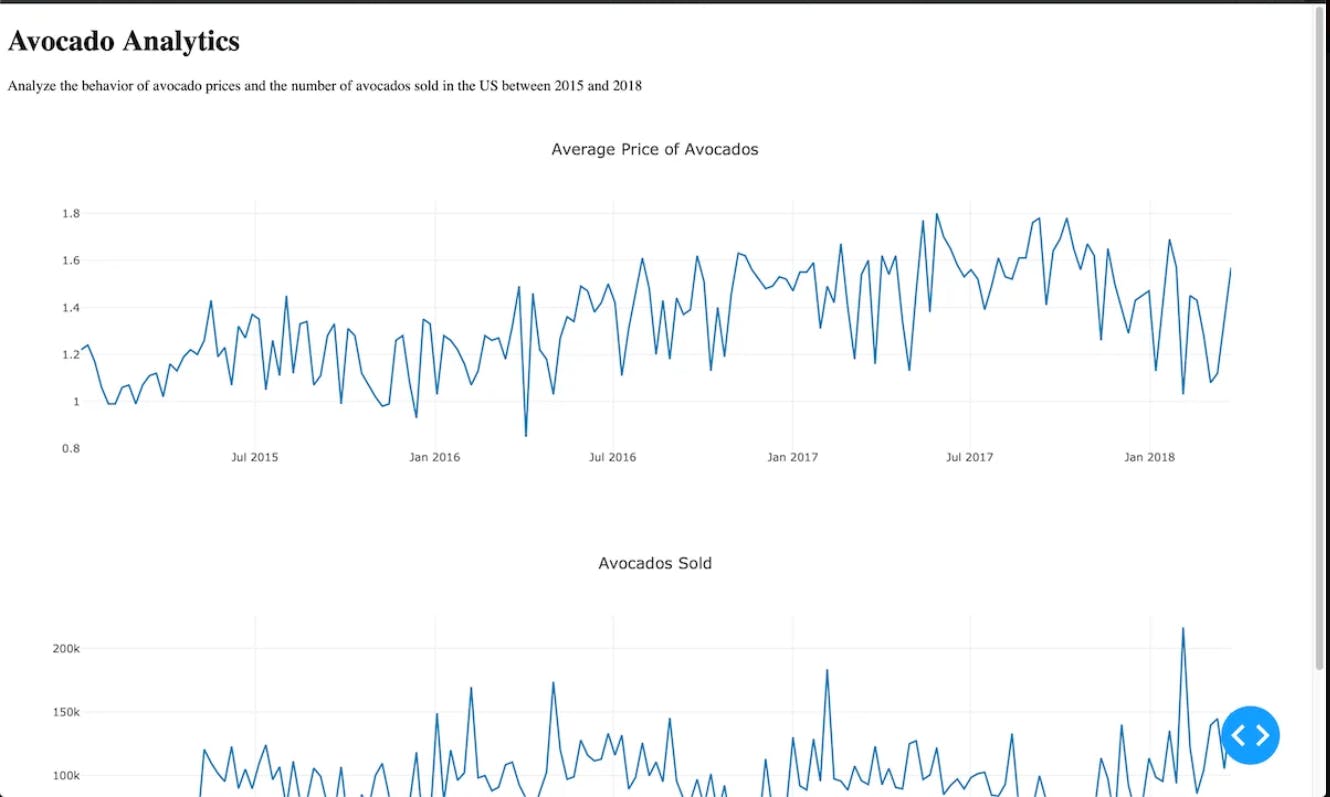
Your first Dash application is running! Congratulations on learning the basics of Dash Application.
In the next blog, we will be adding CSS and Component Interactivity to our application.